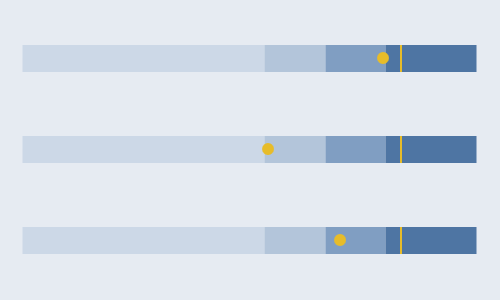
[Excel] How to make a bullet chart
Video tutorial on how to make a bullet chart in Excel
 Video tutorials
A KPI is a single value that represents the state of a metric at a given moment. It is often displayed against a range of desirable/undesirable values encoded into a categorical or continuous color gradient. KPIs can have opposite polarities (higher is good vs. higher is bad), which you should address when displaying multiple KPIs.
The gauge is the most common form of KPI visual. It’s a poor display because it provides little insight and often takes up too much space and a “Big Fat Number” is often a better option. Dashboards consisting only/mainly of disconnected KPI visuals should be avoided, not only from a data visualization point of view: it can be a sign of unclear priorities and reliance on poorly contextualized numbers.
KPI visuals, especially the most maligned ones (like gauges), don’t need to be should be avoided. If not abused, they attract attention and are useful for creating a reference point. A simple reference helps read the dashboard, so there must be some follow-up visual that adds detail to each KPI.
Video tutorial on how to make a bullet chart in Excel
Video tutorial on how to make a simple gauge in Excel