![[Excel] How to make a bar chart with negative values](/assets/images/img_video/video-tutorials-header.png)
[Excel] How to make a bar chart with negative values
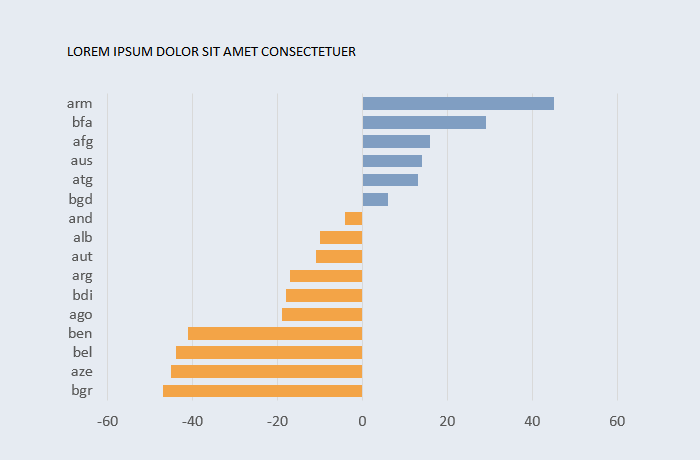
If you have positive and negative values in a bar chart it’s useful to emphasize the difference automatically.
Design notes
- In Excel, you can change the fill color (and other properties) of a data point, or split the series in two and change color for each series. However, in some cases you can set positive and negative fill colors, which is useful if you have a dynamic chart.