![[Excel] How to make a vertical range dotplot](/assets/images/img_video/video-tutorials-header.png)
[Excel] How to make a vertical range dotplot
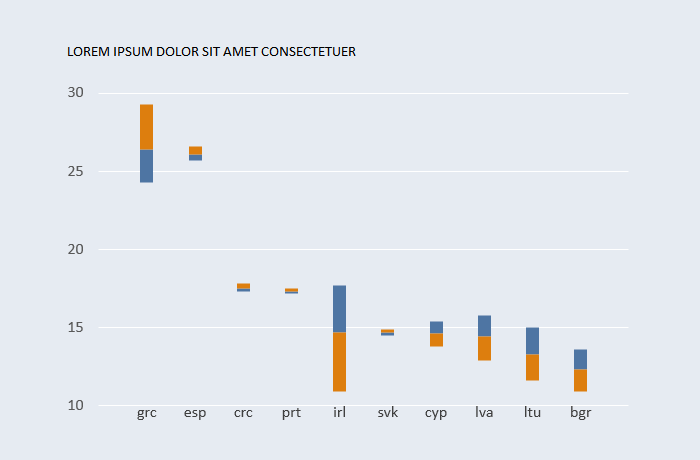
Display the gap from a central value.
Design notes
- Sort categories by the average value.
Video
Notes
- 00:10: Use a rank function to position categories along the y-axis
- 00:15: Columns [Merr] and [Ferr] store the difference of [Male] and [Female] to the [Pop].
- 02:25: Columns [Y0] is used to place category labels.